3. A roman transect
3a. Construction of large popular residential complex
Questions 3a
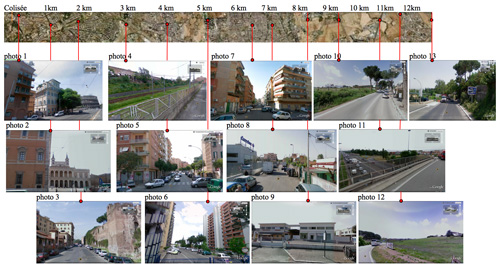
3b. Mosaic of photographs taken from the center to the east of the urban area of Rome
 Click image to enlarge
Source: Google Earth and Google streets, 27-02-2011. Device made by Didier Mendibil.
Presentation 3b
A “transect” is a selective cut done through a circular space in order to study it as a whole but not entirely. Here is a transect of the urban area of Rome made with photographs extracted from Google-Earth.
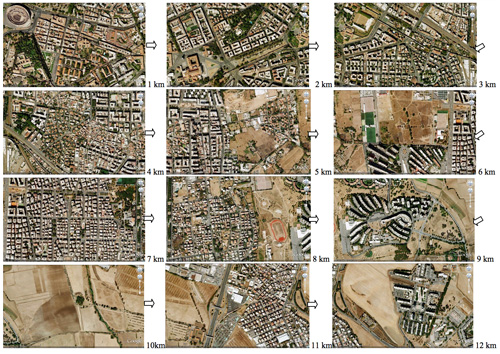
All the aerial photographs placed side by side make a strip of about one kilometer wide and 12 kilometers long eastward the Coliseum.
The photographs taken on the ground were spaced about one kilometer along the same strip eastward the Coliseum.
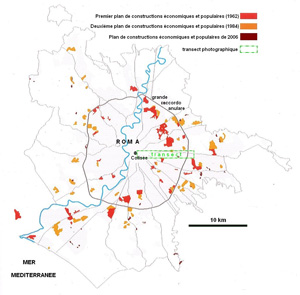
The location of the transect is shown in green dashed lines on the map of document 3a.
Questions 3b
3c. A transect of vertical photographs from the center to the east of the urban area of Rome
 Click image to enlarge
Source: Google-Earth, device made by Didier Mendibil.
Presentation 3c
Beginning in the center of Roma, symbolized by the Coliseum, the transect was drawn eastwards, along the south of the entire Prenestina via, to beyond the Perimeter Highway.
Questions 3c
Answers 3a
- Mapped plots on document 3a are areas where, at various times, the municipality of Rome or the Italian State took the initiative to finance the construction of social housing available to popular residents. These "low-income housing," these so called "HLM" in France, are generally made of numerous apartment buildings.
- Areas of social housing are nearly absent from the ancient city center. They were mainly located in the east and south parts of the city to accommodate about 700,000 inhabitants. We note that they where large and numerous in the plan of 1962 and they became increasingly smaller and more distant in 1984 and 2006 plans. You can understand the progressive renunciation of the Italian authorities when they have become more liberal, to massive social housing operations because of their financial cost and disputed efficiency.
- The building of social housing (Law 167 in Italy) is fighting against an anarchic urbanization both in its location and its unequal distribution of different social categories of population. The aim is to avoid excessive segregation by maintaining some diversity and socio-spatial proximity. It faces many obstacles including the cost of land control and the many examples of speculation. Often it also led to some concentrations of poverty (for example in large groups of Decima or Spinaceto).
In almost every city of Europe the population growth after the war, and in some countries, immigration due to decolonization, have made such housing policies necessary to better control the spread of urbanization and limit spontaneous segregation it causes. Almost everywhere in Europe, the landscape of urban peripheries gives visible traces of these growing pains and efforts, sometimes successful, of social adaptation.
Answers 3b
- Observation of the photographs is not to emphasize the uniqueness of each of them but to identify the criteria which make the particularity of each urban landscape depicted. We note primarily the Roman Coliseum on picture 1, the medieval church of the Lateran on photo 2 and Aurelian Roman wall in photo 3. An aqueduct and a rail on photo 4, small residential buildings and a tree planted street on photo 5, tall buildings for social housing on photo 6, once more small buildings fronting on streets but now without trees on photo 7, small buildings and houses close to a shopping center on photo 8, a small business park on photo 9, old warehouses and new offices on the edge of town on the photo 10 , crossing the ring road in picture 11, a space perhaps agricultural on picture 12 and a country road and a service station in photo 13.
- There are ancient monuments on the first four photographs but, after the railway, are seen primarily residential buildings (photographs 5 to 7) while operations appear anywhere until the eighth photograph. The 10th begins to show non urbanized areas, that is to say, 9 km from the center but in other parts of the transect (see document 3c), we find them even at 5 km from the center of the city.
- Sorting photographs on this transect identifies the limits of the antic historic center (up to 3-4 kilometers from the center) and a residential area (up to 7-8 km) and finally areas where different activities mix on one side and another of the circular Highway. But the observation of satellite images shows that reality is still more complex (see document 3c).
Answers 3c
- Each photo overlaps the surface of its neighbor by about 5%. Densely urbanized area extends eastward up to 4 or 5 kilometers from the center. It then crosses a second residential strip off 1.5 km. Then, between 8 and 12 km and beyond, interspersed nuclei of urbanization, more or less isolated in suburban areas where there are still large gaps.
- Up to 4 kilometers from the Coliseum, we recognize the tile roofs and courtyards, some with trees, of opulent buildings constructed since the nineteenth century in central Roma. A 4.5 km transition, between the heart of the city and suburbs alternates between two poles of popular collective housing recognizable by their long parallel bars, shopping centers and sports fields nearby (5 km and 8 kilometers) on both sides of a sheet of urbanization (between 6 and 7.5 km) characterized by a tight grid of lanes lined with buildings uniformly low and almost compact spaces without vegetation. Beyond the Perimeter Highway (10.5 km to the center) is still continuing this alternating layer of small buildings and centers of social housing separated by farmlands.
- Perhaps because the growth has been more regular in this part of the town, it is fairly easy to recognize the main types of districts such as upper middle-class neighborhoods, the residences of the middle classes and popular areas because they appear spatially well separated. However we see little of suburbia and the concentrations of industries that are more often found in other major cities in Europe. They exist elsewhere in this city but these are not dominant landscapes in the Italian capital that is more intellectual and administrative than worker.
The issue of choosing a personal residence is to involve students in the observation of documents to make them understand that city life is also a matter of personal choice strategy of living and housing. It may also further a debate on the benefits of different neighborhoods here in Rome or elsewhere in Europe.


Presentation 3a
In his thesis, the French geographer Aurélien Delpirou brings up the problem of growth of the urban area of Roma: "The Italian capital has long been a symbol of the city's public transport delays, of the failures of urban planning and of the perversion of public policies by speculative dynamics. It is often presented by Italian researchers as the paradigmatic case of the so-called "genetic defect" of Italian cities: late and anarchic urban growth made without the help of modern communication networks." While seeking to qualify this dominant point of view, he describes a process (which he calls "reverse" of urbanization) of anarchic fusing of urbanized plots : "the fusing was the weld between the combination of public housing programs on distant lands let at a low cost by large landowners, the consecutive extension of the lines of tram and trolleybus, and speculative increase in value of the intermediate spaces by private property developers widely controlled by the same owners (...) engendered in all welds cases a linear expansion, which juxtaposed rows of apartment buildings and a less dense housing estate." This development is hinted at certain points of the transect but it is not the specifically studied area by Aurélien Delpirou.